The University of Chicago Library
Search
Library Catalog
Database Finder
Website Search
Your Library Expert
All experts
News
View all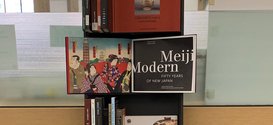
Museum Reads at the Library: Meiji Modern
A collection at Regenstein Reserves supplements a Smart Museum exhibition on Fifty Years of New Japan.
Read more...

Announcing a new Library book club for students
The Reg Reads Book Club will feature a monthly selection from our popular reading collection.
Read more...
New Nature journals now available
19 new Nature journals are now available through the Library.
Read more...

Knowledge@UChicago reaches 10,000 scholarly and creative works and 2 million downloads
The repository provides open access to UChicago scholarly content from academic journal articles to dissertations and theses to patents and more.
Read more...