Transformation
Converting FITS files
In order to use our next tool, we must convert our FITS files from black stars on a white sky to white stars on a black sky. This transformation also helps to better measure the magnitudes of bright stars – the center of the star images are weighted more during transformation, so the magnitude measurement of bright stars is much more accurate after a file is transformed.
We convert FITS files using this code in Python:
import os
import math
import numpy as np
from astropy import wcs
from astropy.io import fits
import csv
import sys
from array import array
hdu1 = fits.open('/XXXXX') – select the folder where the FITS file is located
data = hdu1[0].data
header = hdu1[0].header
sizex = int(header['NAXIS1'])
sizey = int(header['NAXIS2'])
bits = int(header['BITPIX'])
max = math.pow(2, bits)
print, sizex, sizey, max
ix = 0
jy = 0
for jy in range(0, sizey):
for ix in range(0, sizex):
T = data[jy,ix]
data[jy,ix] = TRANSFORMATION EQUATION
fits.writeto('XXXX.fits', data, header, overwrite=True) – name file appropriately for your file management protocols
The Transformation Equation
The transformation equation continues to be refined, adapted, and reworked for different scenarios. It is influenced by both the lack of a linear relationship between the magnitude of stars and the emulsion on the plate, as well as the lack of a linear relationship between the scanner output and plate density. These obstacles are not insurmountable!
The function T(in) = 65535/s corrects for the scanner output to plate density. T(in) = transformed output, 65535 is the maximum scanner output, and s is scanner output. Additional factors are necessary to transform the output further, including a multiplicative factor to establish a 1:1 slope, a factor to correct for the zero output of the scanner, and a scaling factor which ensures appropriate outputs in a limited yet acceptable range of densities.
Recently, we utilized the equation T = 86.0 x (65535/(s-6000))^1.75 for a Barnard Atlas plate and are exploring a transformation equation that could be utilized for all plates in a series, or all plates with similar sky background values.
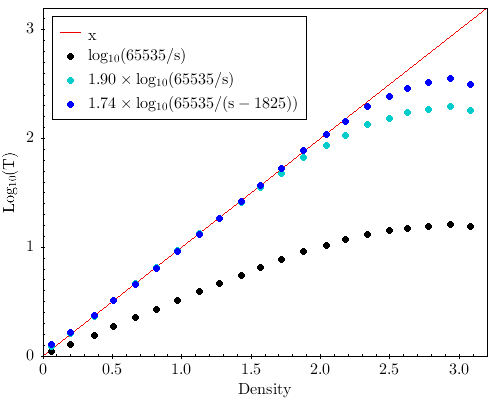
This figure demonstrates the 3 stages of equation evolution as applied to our standard, the Stouffer Step Wedge: The red line is the 1:1 relationship we want to see, the black/lowest dots show the correction for output to plate density only, the teal/middle dots include the scaling factor, and the blue/top dots include the correction for the scanner’s zero point. As you can see, each iteration brings the output closer to the 1:1 correlation across a wider range of densities, although there are always densities which will fall outside the range for which we are able to correct with this type of transformation.
After a transformation equation is derived, it is applied to each pixel value of the image via the above code, resulting in a positive image, which is then compatible with Aperture Photometry Tool, our magnitude measuring software.
Support for this project comes from the National Science Foundation (Grant AST-2101781), University of Chicago College Innovation Fund, John Crerar Foundation, Kathleen and Howard Zar Science Library Fund, Institute on the Formation of Knowledge, and Yerkes Future Foundation.