The exhibit was written by Megan Ekstrom and curated by Cecilia Smith
A pioneer in her field, renowned cartographer Marie Tharp undoubtedly influenced the course of mid-twentieth century geography in America. Born in 1920, her childhood featured an early exposure to mapmaking in the form of her father, William Tharp. He was employed to draft soil maps for the U.S. Department of Agriculture, some of which can be found in the library’s Map Collection. Marie didn’t possess her father’s passion for mapmaking at first, and instead she pursued a B.A. in English literature at Ohio University. According to historian Cathy Barton, Marie may have expressed interest in attending the University of Chicago and adapted her undergraduate coursework to reflect the program offered there.
With the onset of World War II, universities across the United States started admitting more women into scientific programs, in the hopes of replacing the depleting male workforce. As a result, Marie was given the opportunity to acquire degrees in both geology and mathematics. Marie’s employment as a research assistant at the Lamont Geological Observatory in Columbia University in 1948 witnessed the seamless marriage of her unique skillsets. She was assigned to draft maps of the ocean floor according to data sets collected by echolocation technology on sea vessels.
At this time, incredibly little was known about the characteristics of the earth’s sea bed. Marie described it as, “a blank canvas to fill with extraordinary possibilities.”[1] Bruce Heezen, her supervisor and later co-collaborator, enforced meticulous standards for the data his team collected aboard each ship in the Atlantic Ocean. When Marie received his depth measurements, she plotted each point in physiographic diagrams of the ocean floor. As her work developed, she compared the shape of the ridges she had drawn and immediately noticed a “V-shaped indentation in the center of the profiles.”[2] The concept of continental drift was not unheard of, but it was generally dismissed among scholars. Bruce infamously ridiculed Marie’s findings as “girl talk” initially.[3]
Nonetheless, by 1953, Bruce could no longer refute Marie’s suspicion, as his research on earthquake activity in the Atlantic seemed to confirm her discovery. The first physiographic map of the North Atlantic Ocean was published by Bruce and Marie in 1957. Henceforward, Marie’s topographical observations would be undeniably, “crucial to the eventual acceptance of the theories of plate tectonics and continental drift in the earth sciences.”[4] The authenticity of their findings solidified when improvements in technology allowed them to revise earlier work and make corrections. Scientists would one day prove the accuracy of Marie’s maps with advanced satellite imaging. Following Marie’s breakthrough analysis of the Atlantic, Bruce and Marie expanded their research to include the entire ocean. Starting with the Indian Ocean, they mapped the seafloor in segments around the globe. Over the course of thirty years, they had accumulated enough data to produce the first full map of the ocean floor in 1977.
The quality and quantity of Marie’s contributions as a female cartographer are arguably unprecedented. Despite being a minority in a field full of men, she made a lasting impact on the scientific community with the publication of her maps and her co-authorship of several books and articles. She not only drew attention to continental drift in the Atlantic Ocean, but also made the world’s sea floor accessible where before it had been entirely uncharted. Marie best sums up her remarkable career with the modest comment, “I think our maps contributed to a revolution in geological thinking.”[5]
[1] Marie Tharp, “Connect the Dots: Mapping the Seafloor and Discovering the Mid-Ocean Ridge,” Lamont-Doherty Earth Observatory of Columbia: Twelve Perspectives on the First Fifty Years 1949-1999, Last modified April 1, 1999, Edited by Laurence Lippsett. https://www.whoi.edu/page.do?pid=7500&tid=7342&cid=23306.
[2] Ibid.
[3] Ibid.
[4] “Marie Tharp,” Columbia University online. Accessed November 7, 2018. https://www.whoi.edu/page.do?pid=7500&tid=7342&cid=23306.
[5] Marie Tharp, “Connect the Dots.”
[6] Ibid.
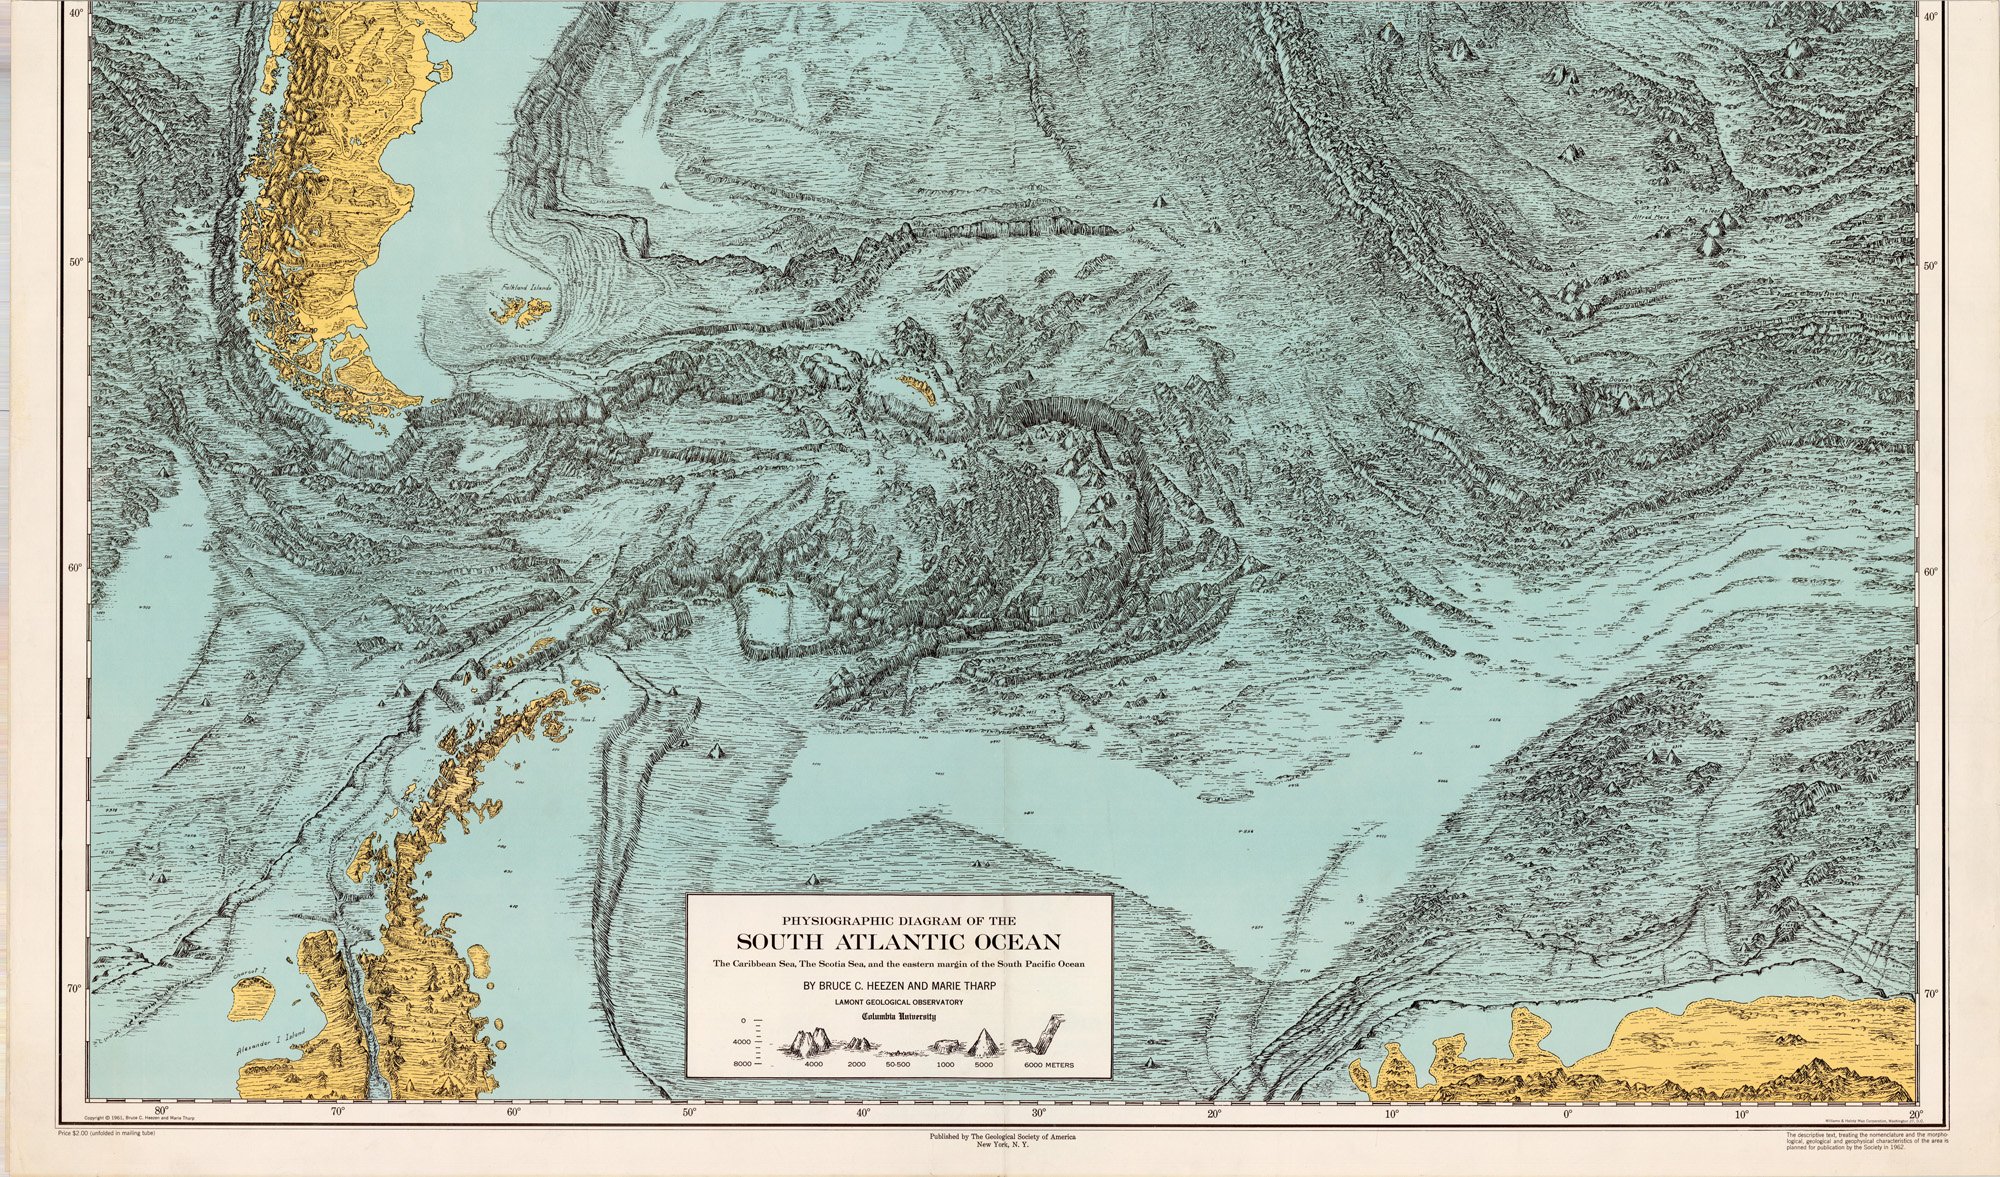
Physiographic Diagram of the South Atlantic Ocean. Map Collection. Regenstein Library: G9166.C2 1961 .H4 MapCl
Reproduced by permission of Marie Tharp Maps, LLC 8 Edward St. Sparkill, NY 10976.
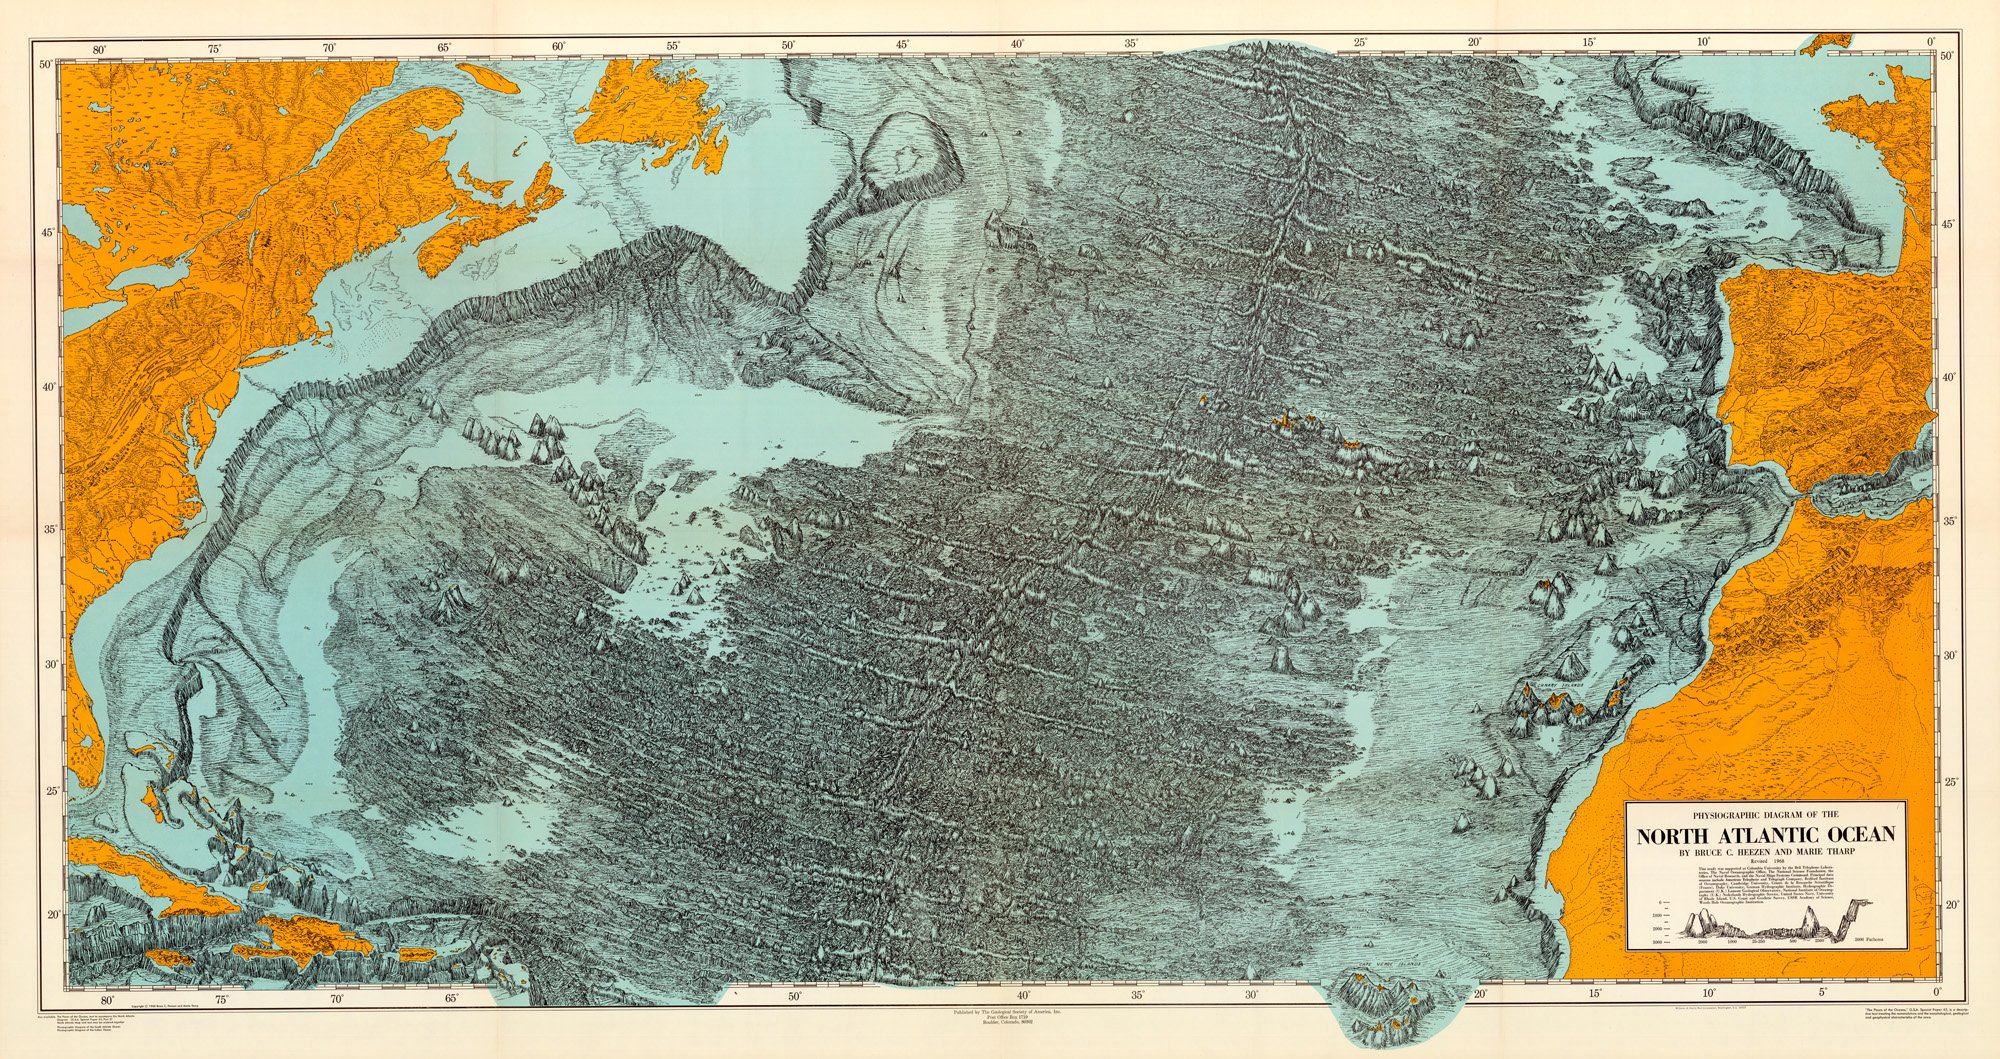
Physiographic Diagram of the North Atlantic Ocean. Map Collection. Regenstein Library: G9111.C2 1968 .H4 MapCl
Reproduced by permission of Marie Tharp Maps, LLC 8 Edward St. Sparkill, NY 10976.
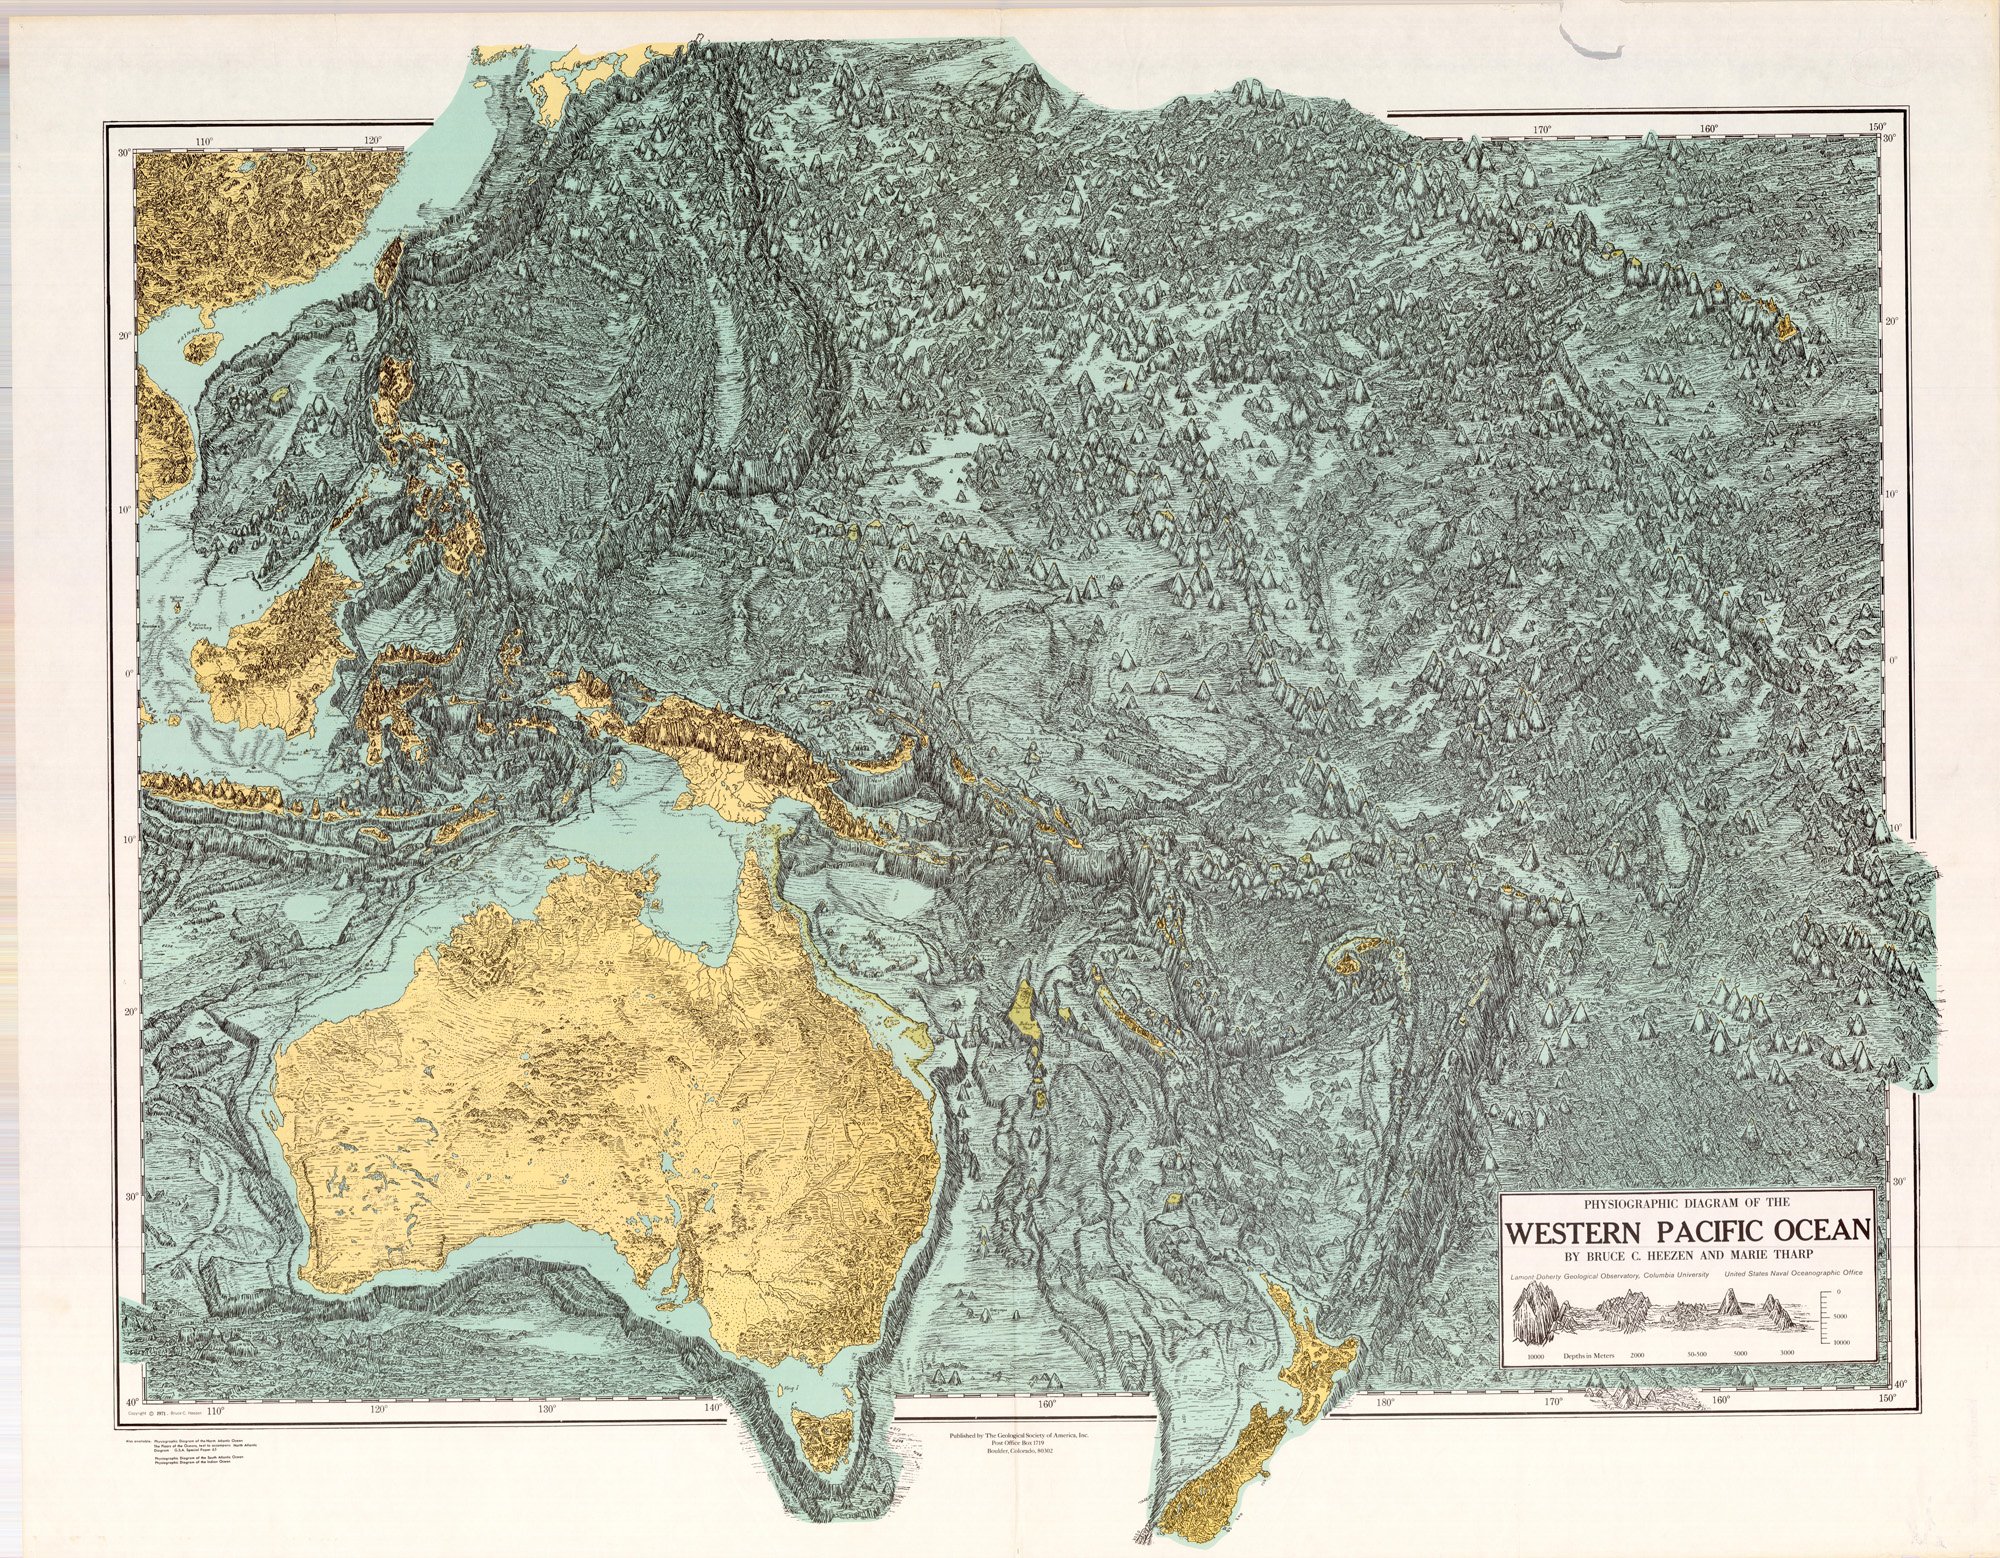
Physiographic Diagram of the Western Pacific Ocean. Map Collection. Regenstein Library: G9231.C2 1971 .H4 MapCl
Reproduced by permission of Marie Tharp Maps, LLC 8 Edward St. Sparkill, NY 10976.
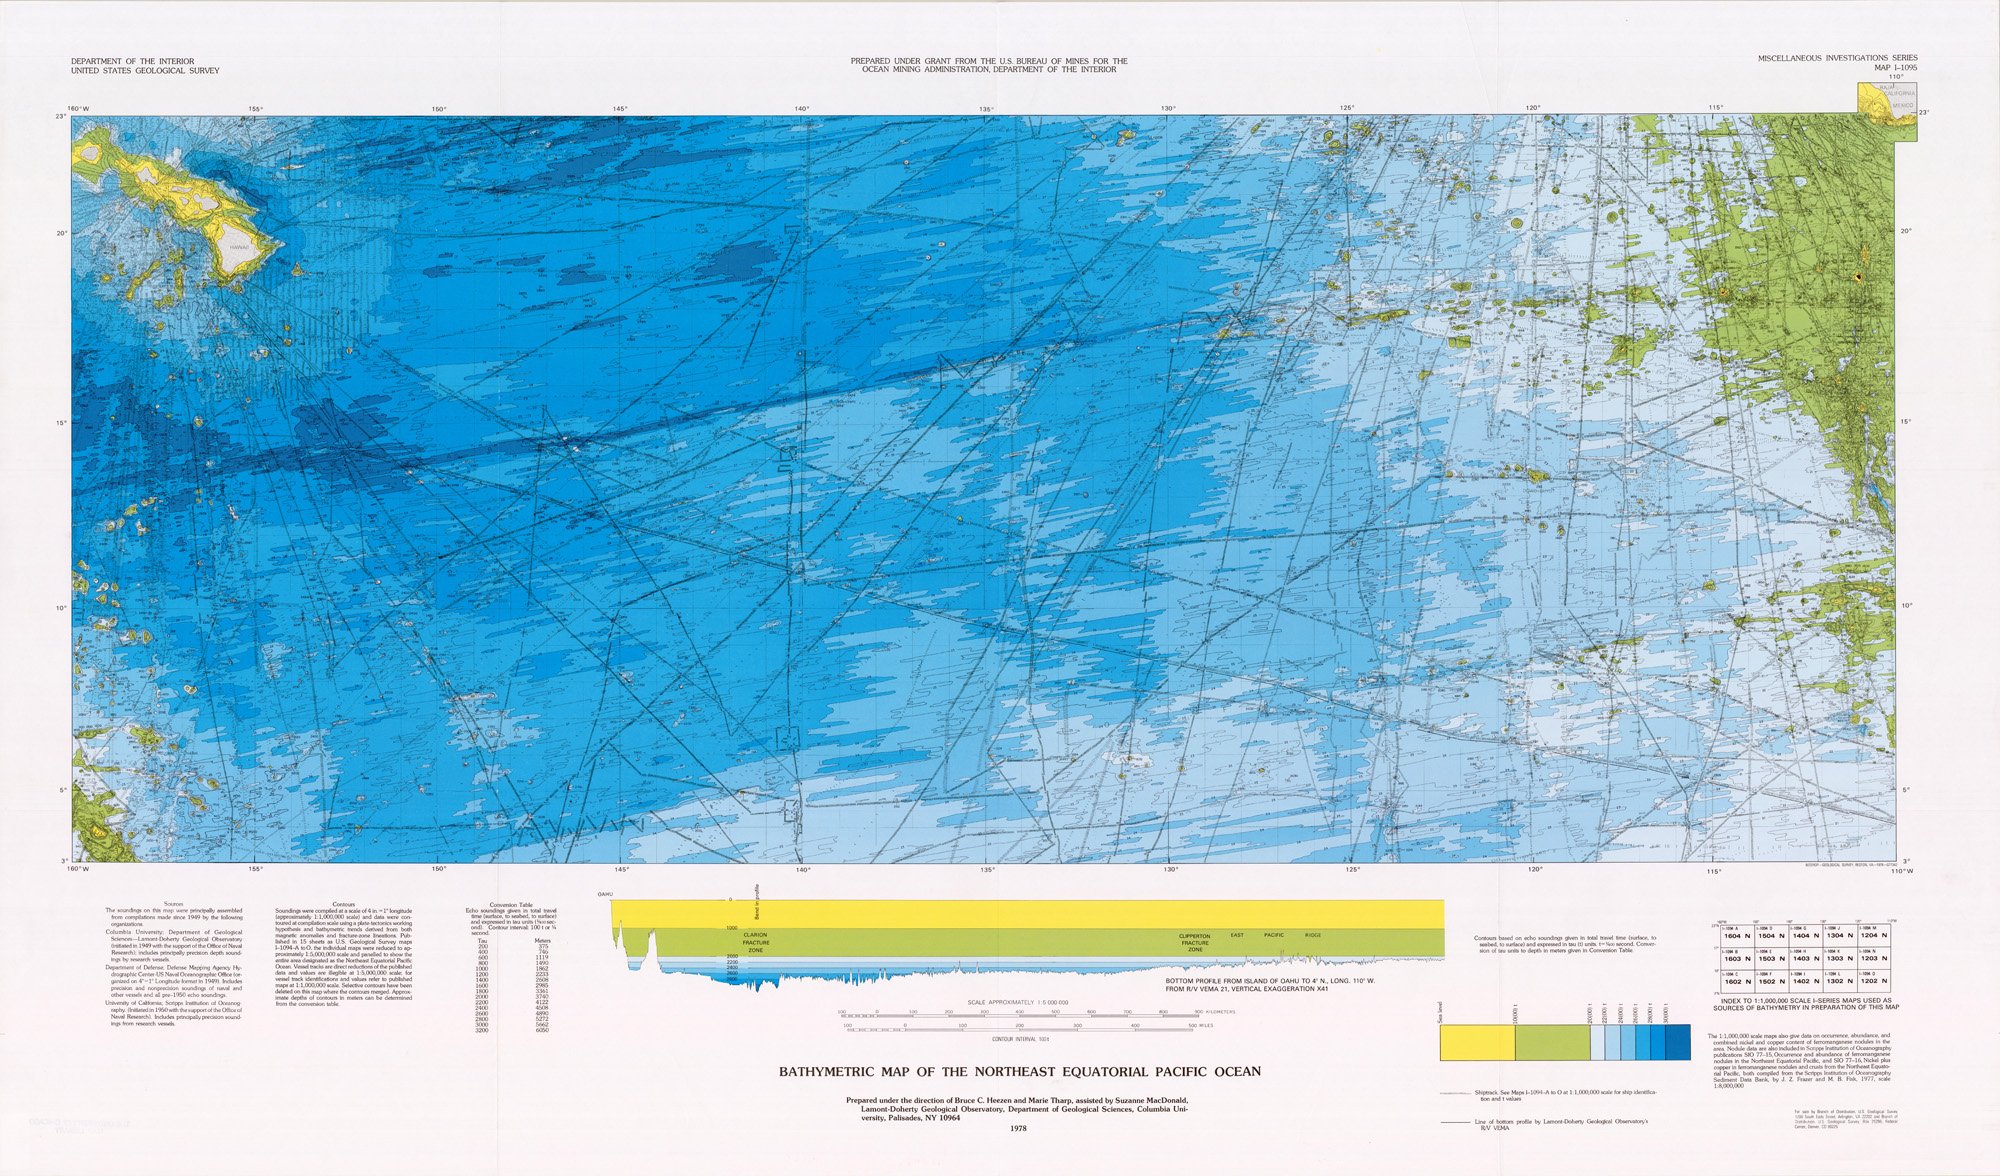
Bathymetric Map of the Northeast Equatorial Pacific Ocean. Map Collection. Regenstein Library: G9236.C2 1978 .H4 MapCl
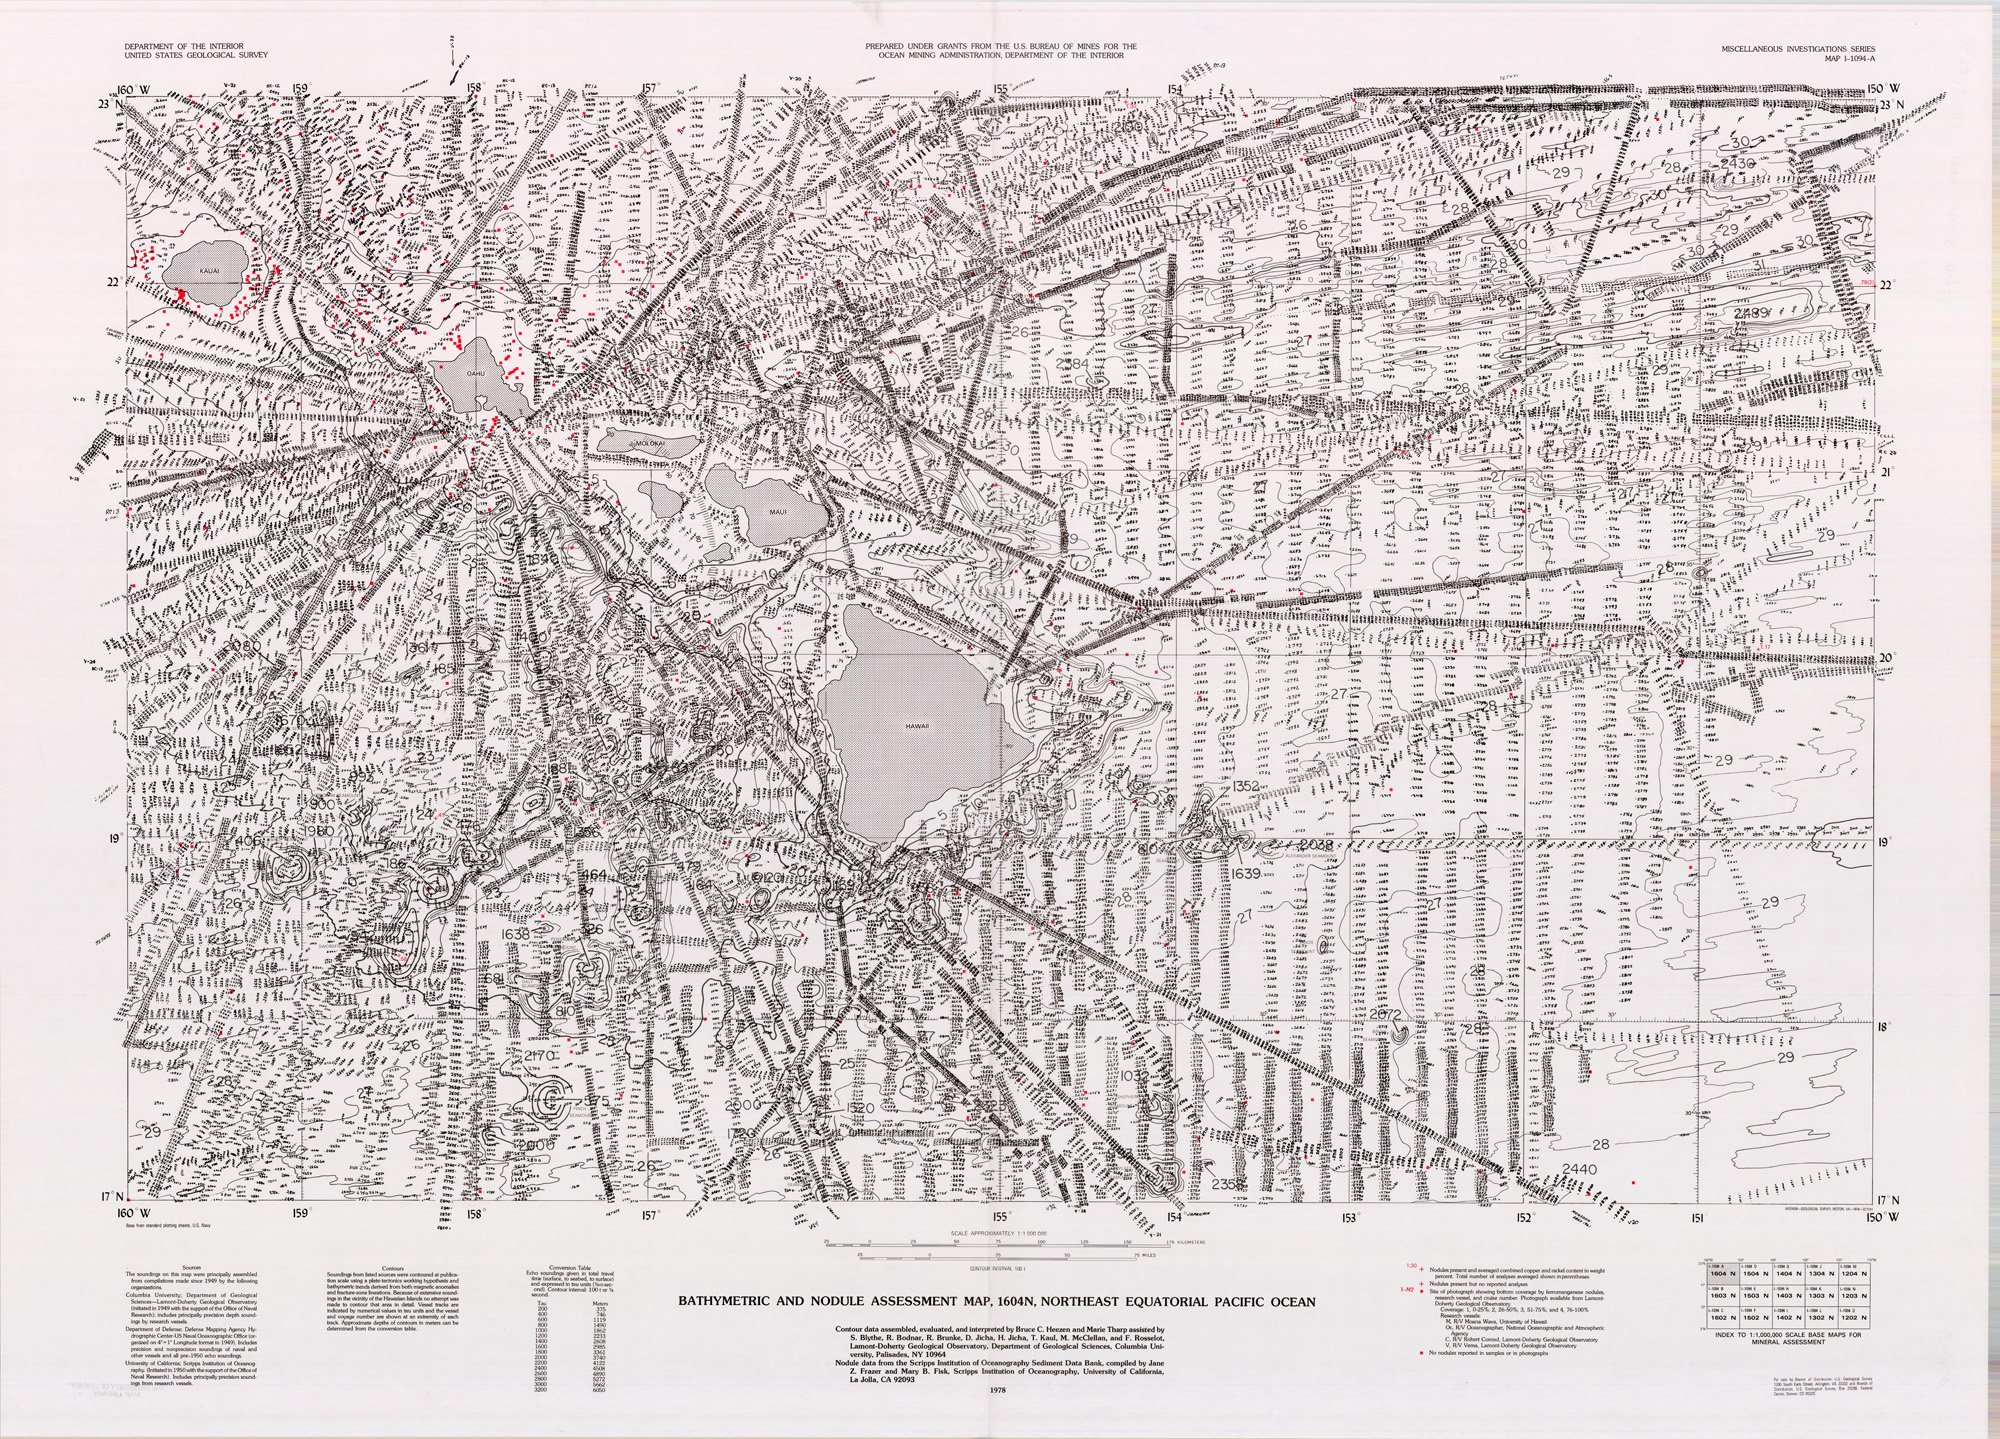
Bathymetric and Nodule Assessment Map, 1604n, Northeast Equatorial Pacific Ocean. Map Collection. Regenstein Library: G9236 .H2 1978 .G25 MapCl
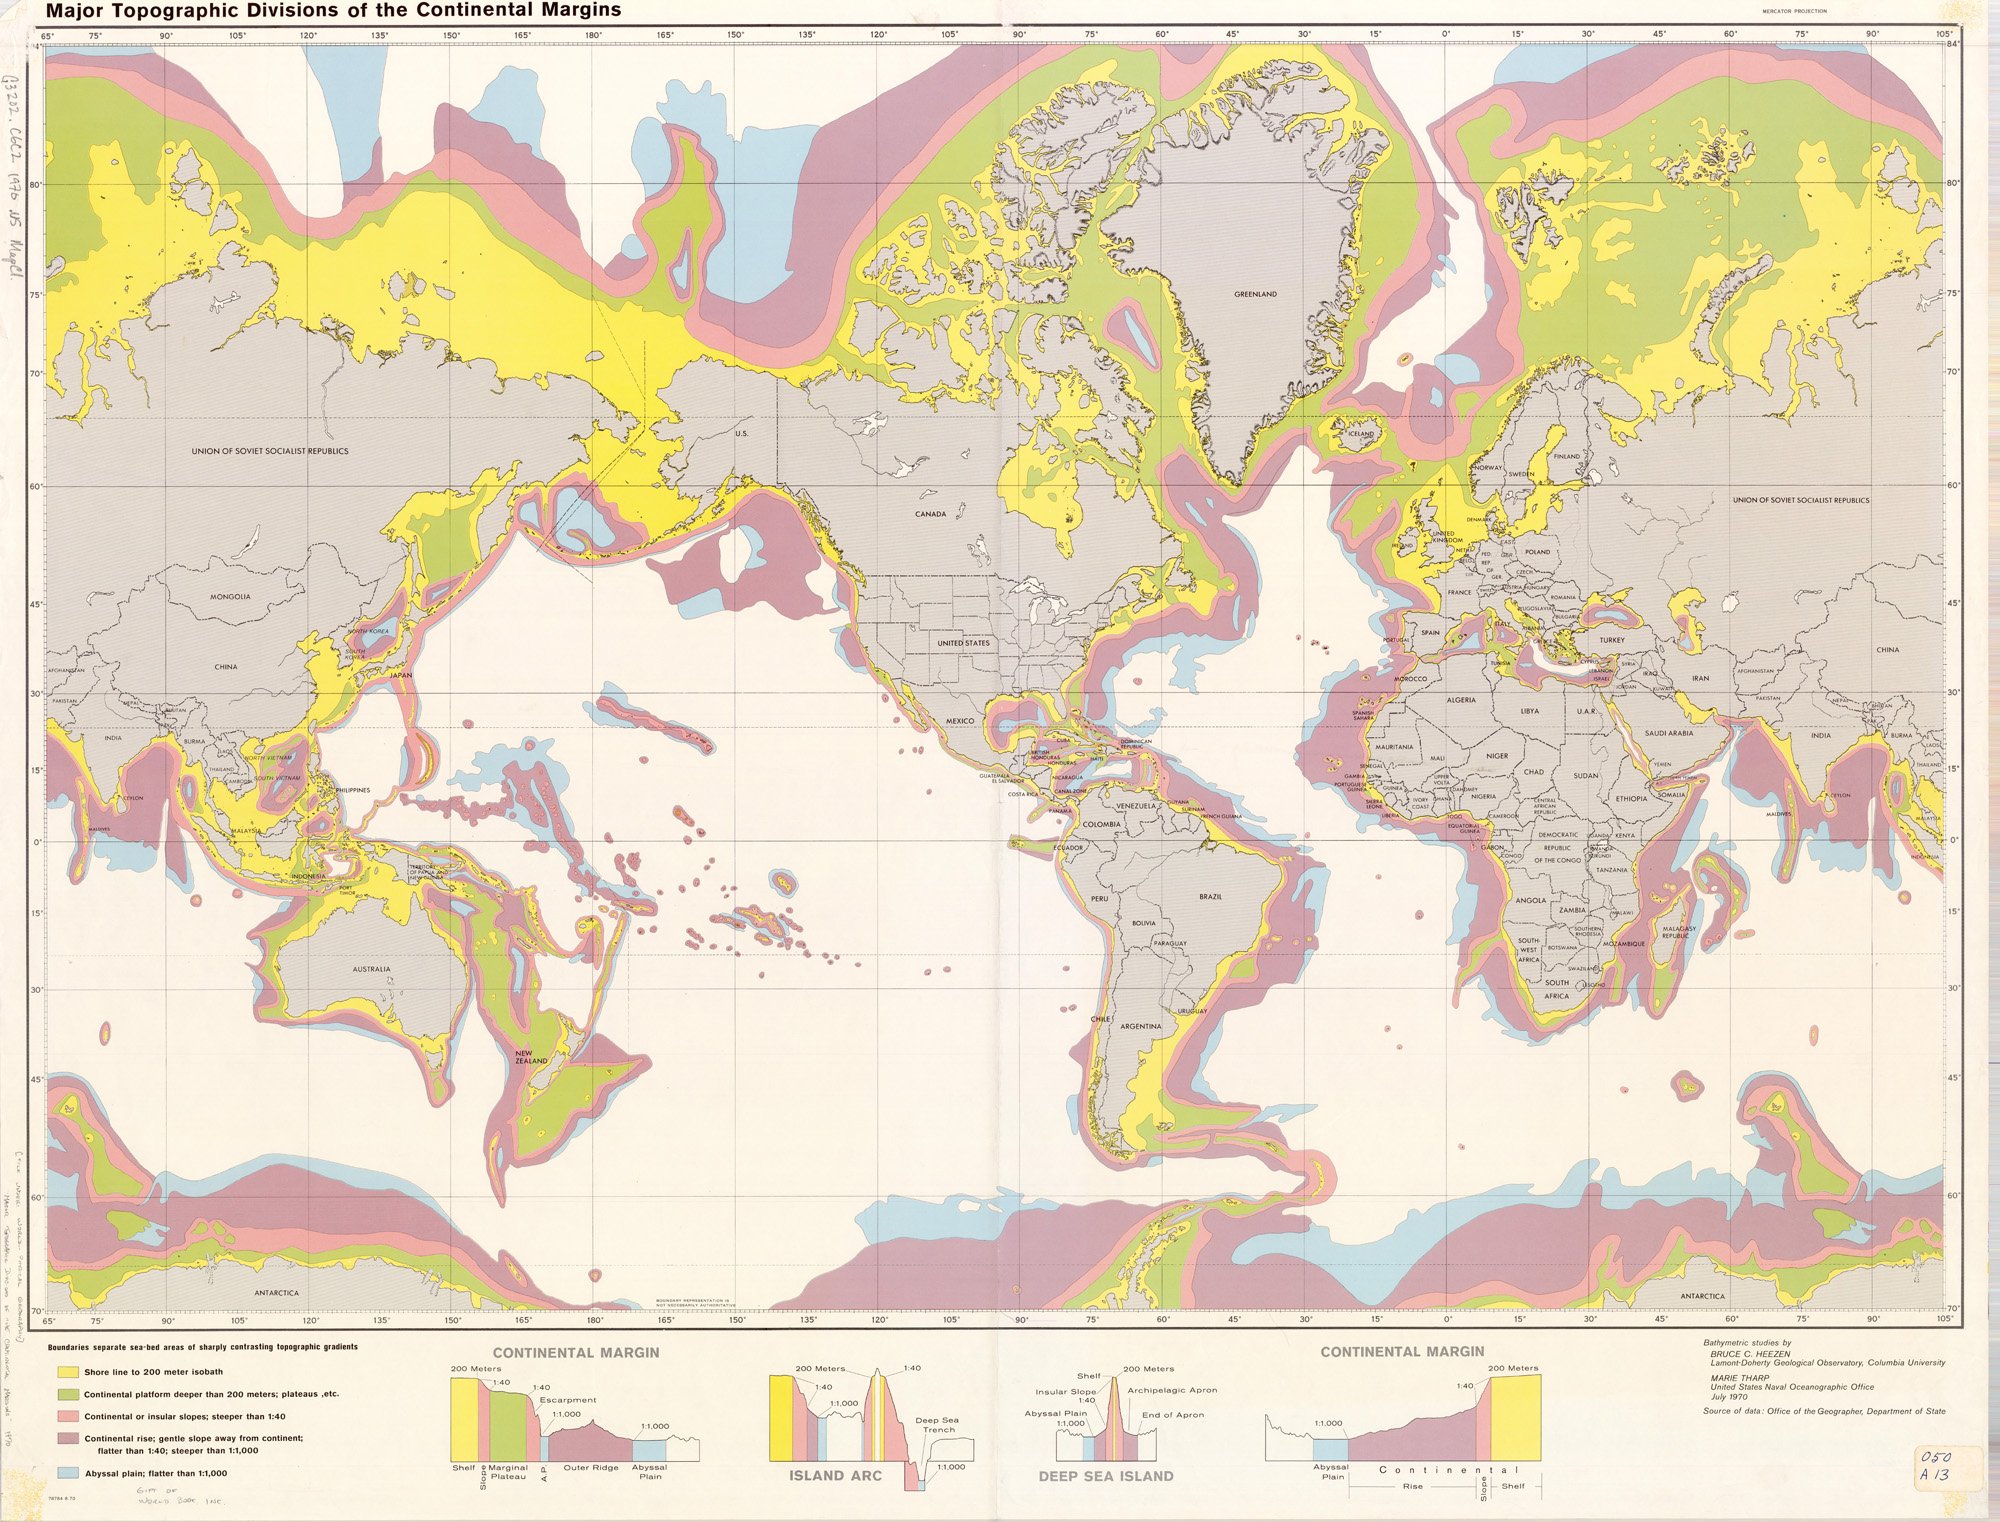
Major Topographic Divisions of the Continental Margins. Map Collection. Regenstein Library: G3202.C6C2 1970 .U5 MapCl