Epsilon Aurigae: A Case Study of Spectroscopic Work
Created by members of the Capturing the Stars student project team (alphabetical by last name): Daniel Babnigg, Ha Do, Isaiah Escapa, Rachel Kovach-Fuentes, Richard G. Kron (faculty advisor), Harper Learmonth, and Nicole Millan Ortiz
Introduction
The field of astronomy — and, by extension, astrophysics — is, perhaps surprisingly,
dominated by spectroscopy: the process of analyzing starlight by separating the component colors that comprise its spectra. At Yerkes, staff astronomers recorded spectra on glass plates, creating spectrograms that could be measured using high-precision microscopes. Among these astronomers were Evelyn Wickham and Dorothy Block, who took particular interest in epsilon Aurigae: a binary system made up of a supergiant and its dark mysterious companion which causes the star to experience a total eclipse every 27 years. Wickham and Block, among other Yerkes astronomers, were inspired to capture spectra of the binary before and around its 1929 eclipse. Their results were reported in a paper published in 1932.
Our team has recovered these spectrograms, among others, from the extensive plate collection at Yerkes Observatory, greatly aided by documentation in the observing logbooks. We’re currently digitizing the plates to make these data, from 1928 to 1930, accessible to modern astronomers, with the expectation that an older comparison base may provide further insight into the binary’s properties.
Women and their roles
Our “recovery work” at Yerkes Observatory, while focused on the spectrograms, also provided valuable insight into Wickham and Block’s respective (and extensive) work at the Observatory. Although they held different positions — Block as “Assistant for Stellar Spectroscopy” and Wickham as “Computer” — they both demonstrated a deep fascination with spectroscopic research that, though not as heavily advertised, arguably matched the caliber of their male counterparts, like Edwin Frost and Otto Struve.
Wickham and Block are just two, of the multiple, women who’ve worked at Yerkes through the years, aiding in the advancement of astronomical research despite their — until now — limited recognition.
University of Chicago, Photographic Archive.
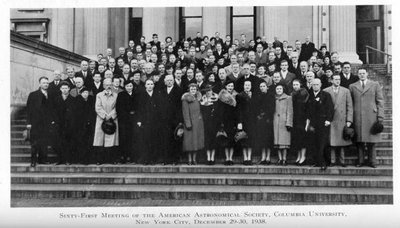
Publications of the American Astronomical Society
Group photo taken at the Sixty-First Meeting of the American Astronomical Society in New York City, 1938, featuring Wickham near the top right corner
University of Chicago, Photographic Archive
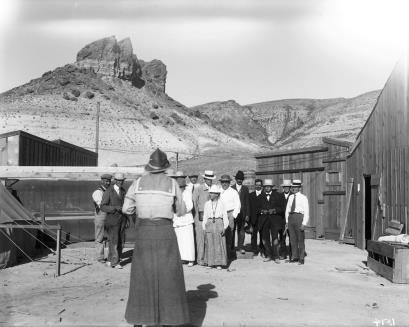
“Evelyn W. Wickham photographing the Yerkes group at Camp Charles A. Young, Green River, Wyoming just after the eclipse.”
University of Chicago Photographic Archive, Hanna Holborn Gray Special Collections Research Center, University of Chicago Library.
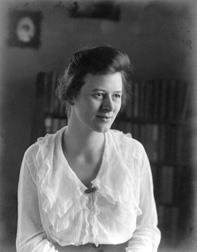
After graduating from Vassar College in 1916, Evelyn Wickham became a student at the University of Chicago, where she received her MS in 1917. During this time, she conducted research analyzing spectrograms and computing stellar parallaxes at Yerkes Observatory, supported, in part, by Harvard University. Wickham left the Observatory in 1919, finding work as an engineer in the Department of Development and Research at the American Telegraph and Telephone Company in New York. Despite this, she remained an active member of the community, attending the 1938 American Astronomical Society meeting at Columbia University.
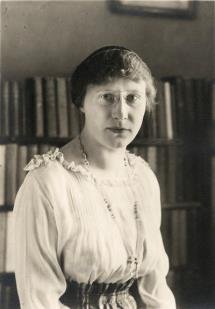
Dorothy W. Block studied at Hunter College and Columbia University before taking up a position at Yerkes Observatory in 1919. Block began working on her PhD at UChicago, conducting research on stellar spectroscopy, which included operating the 40-inch refracting telescope. After leaving Yerkes, Block took on a managing role at a number of observatories across three continents, including the National Observatory of Greece and Harvard College Observatory's Southern Station. Block and her husband later moved to South Africa, where they continued astronomical work.
Epsilon Aurigae
ε Aurigae is a highly unusual binary star system that still baffles astronomers today. The visible star (a so-called F supergiant) is eclipsed every 27 years by an opaque disk of small particles surrounding an unseen star of unknown nature. The eclipses of 1901-1902 and 1928 -1930 were studied intensively by astronomers at Yerkes Observatory. These spectroscopic observations enabled the velocity of the visible star to be determined throughout its 27-year cycle, which in turn placed constraints on the mass of the unseen star. Based on such data, a physical model for the system was proposed in 1937 by Yerkes astronomers Otto Struve, Gerard Kuiper, and Bengt Strömgren (one of many attempts to do so). Modern interferometric data have confirmed that the system is composed of a bright F-type star and a cool disc that periodically obscures the F star.
University of Chicago Special Collections
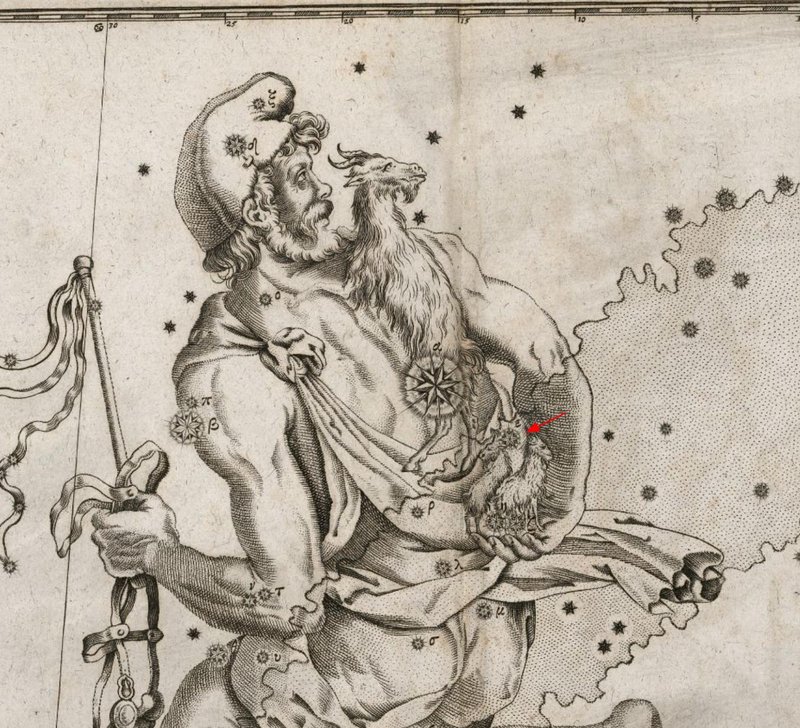
Constellation Atlas by Johann Bayer 1603 showing location of Epsilon Aurigae.
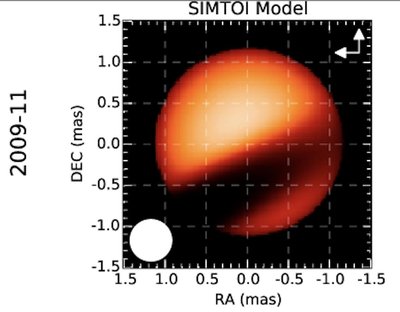
Epsilon Aurigae is among the stars that are large enough to be resolved with modern interferometric techniques. This image is taken from a 2015 research paper by Kloppenborg et al. https://iopscience.iop.org/article/10.1088/0067-0049/220/1/14#apjs518847f5 The white circle indicates the limiting angular resolution of the image. The dark diagonal band partially covering the star is a dense disk of dust. As the disk orbits the visible star, it causes eclipses every 27 years. Spectra such as the ones obtained at Yerkes during the 1928-1930 eclipse contribute detailed information about the motions of gas associated with the star and the disk.
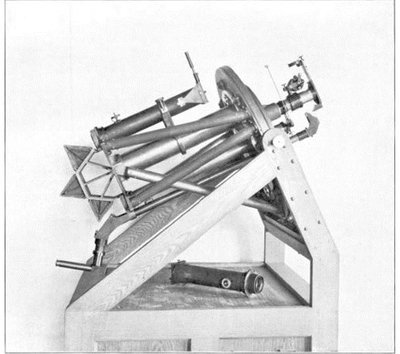
1902 article "The Bruce Spectrograph of the Yerkes Observatory" by Edwin Frost.
Spectrographs are instruments which use prisms to disperse incoming light from a specific object into its component wavelengths, revealing information about that object. The Bruce Spectrograph was designed specifically for work at Yerkes starting in 1899, and the instrument was mostly complete by 1902. The Bruce Spectrograph was advanced for its time, with increased light power compared to earlier spectrographs which allowed for fainter stars to be observed. The image above depicts the 3-prism configuration of the spectrograph; these prisms would have been covered during use to prevent light leaks.
Breaking down the 1932 paper
A spectrogram has much of its valuable information on the plate itself, but metadata that is significant both scientifically and historically can be found in the corresponding logbooks. The logbooks and the spectrograms considered together can reveal a more complete context to understand the eclipse of epsilon Aurigae, and all the types of labor that went into producing the final paper.
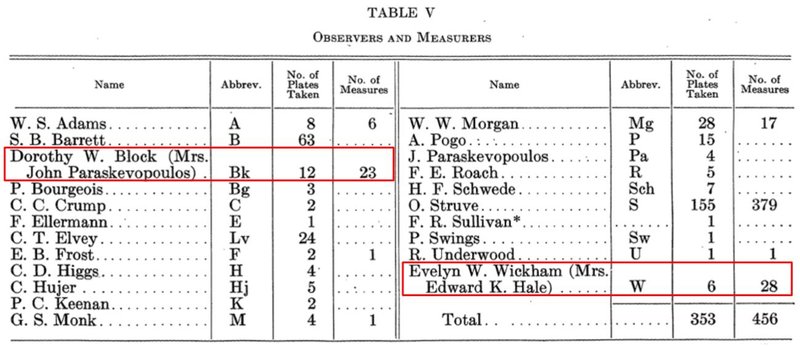
A list of the observers at the telescope and measurers for the spectrum of epsilon Aurigae. Table V from “A Study of the Spectrum of 7ε Aurigae” (Struve, 1932).
The table displays the number of spectrograms observed and measured by the people at Yerkes who were involved in studying the spectrum of epsilon Aurigae around its 1929 eclipse. The “No. of Plates Taken” column refers to the process of observing the system with the attached Bruce Spectrograph on the 40-inch Refractor, and the “No. of Measures” column refers to the measurement of the developed spectrograms. The first two columns give insight to the large team that worked on studying the 1929 eclipse of epsilon Aurigae, which included Dorothy W. Block and Evelyn W. Wickham who participated in both observing and measuring a significant portion of the numerous total spectrograms.
Yerkes Observatory logbooks
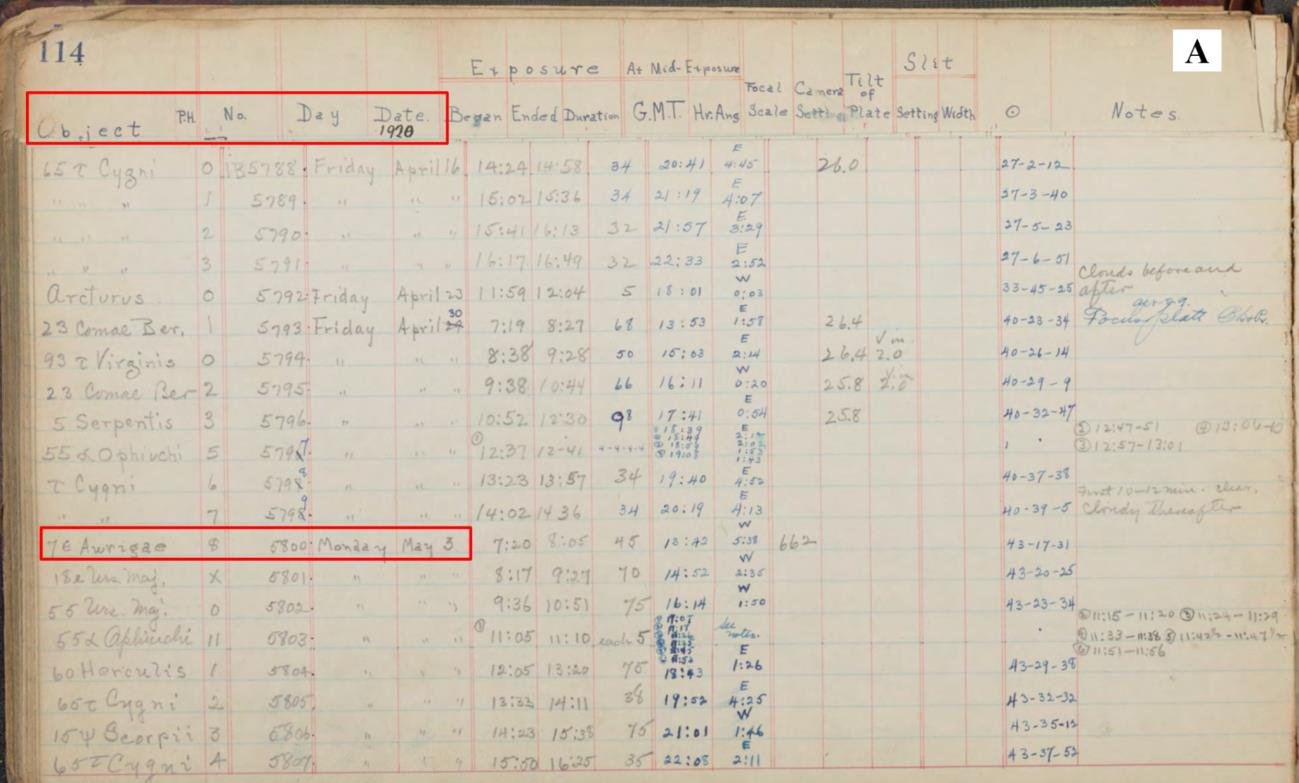
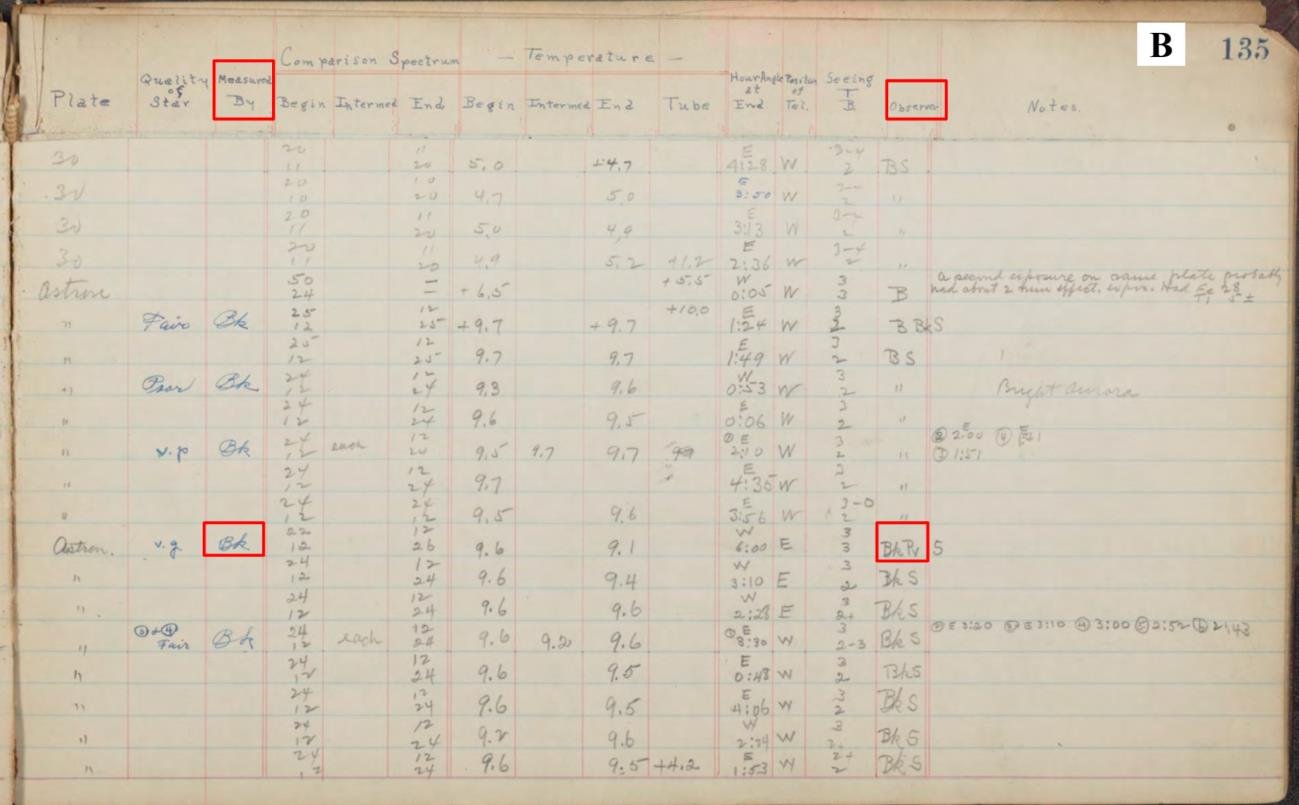
A spectroscopic logbook showing an entry of a spectrogram taken of epsilon Aurigae
Yerkes Observatory logbooks
Yerkes Observatory’s extensive collection of logbooks includes important scientific and historical context about the plates, including spectrograms. This spectroscopic logbook is formatted across two pages, with each row representing a separate plate. The columns include information such as the name of the observed object, the plate number, the date and time, other technical information, as well as the initials of the people who observed and measured the spectrogram. This section of the logbook shows spectra plate IB5800 which was taken May 3rd, 1920 of epsilon Aurigae before its eclipse (Item A), where Dorothy W. Block, noted as “Bk”, contributed to the measurement and observation of the spectrogram (Item B).
Yerkes Observatory glass plates
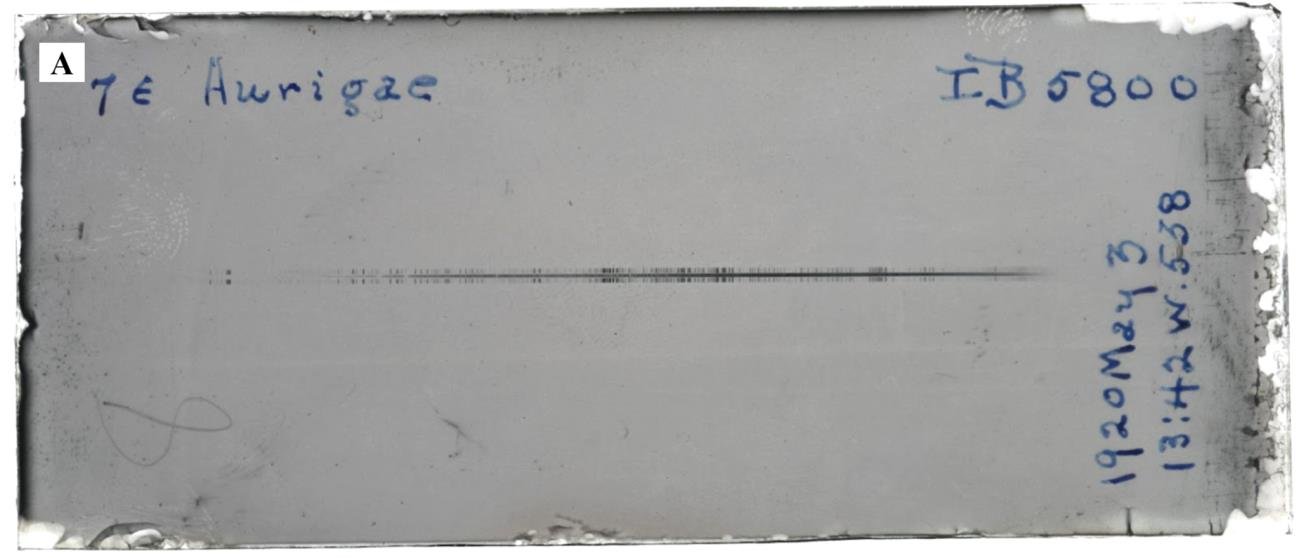
An epsilon Aurigae spectrogram taken and measured by Dorothy W. Block

Yerkes Observatory glass plates
The digitized spectragram IB5800 measures 10 x 4 cm in size, with the full plate containing the spectrum, along with annotations for the name of the object, the plate number, as well as the date, time, and hour-angle at mid-exposure (Item A). The age, imperfect preservation, and handling of the plate over time caused the rough edges where the emulsion is peeling away from the plate, along with fingerprints, blemishes, and other artifacts. The spectrum itself measures about 1 mm in thickness, and a portion of the spectrum shows the picket fence of lines flanking the spectrum which are comparison lines for wavelength calibration, and the gray band in the center which is a negative of the spectrum itself (Item B). The actual spectrum would appear violet through green if viewed in color through the Bruce Spectrograph attached to the 40-inch Refractor.

Yerkes Observatory glass plates
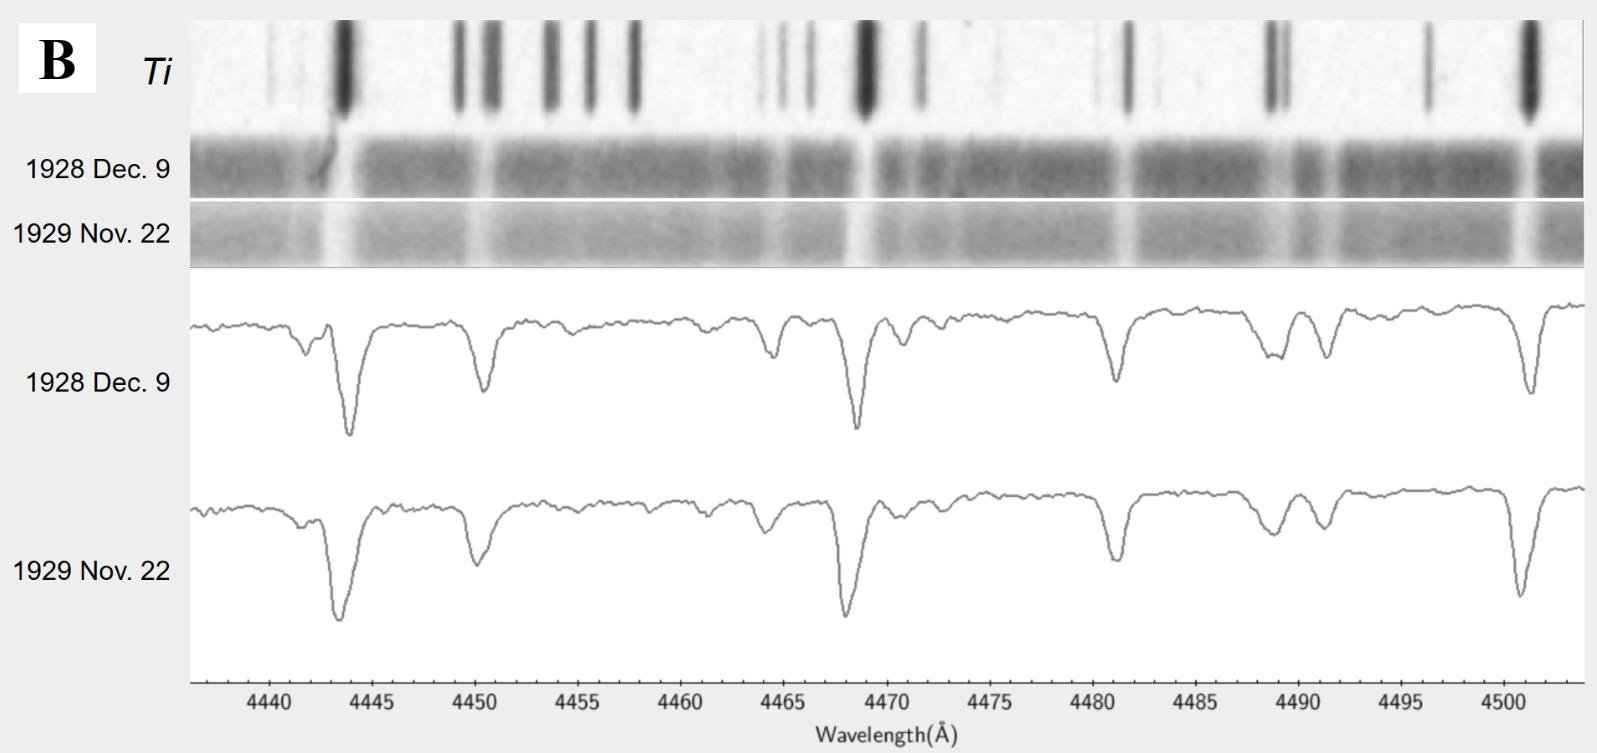
Two plates’ spectra along with their line extractions, separated by about 11 months in time during the eclipse of epsilon Aurigae. Plate II from “A Study of the Spectrum of 7ε Aurigae” (Struve, 1932).
Yerkes Observatory glass plates
Reproduction of Plate II using a modern digitizer and calibration methods.
Plates R1454 from 1928 Dec. 9 and R1635 from 1929 Oct. 25 - from different periods of the eclipse of epsilon Aurigae - were used to produce a figure that shows the spectrums calibrated to the same wavelength range, and their corresponding line profiles (Item A). The same plate R1454 and the slightly later plate R1691 from 1929 Nov. 22 were accessible for digitization, and a similar figure was produced using a Epson Scanner and programmatically derived calibration methods (Item B). The figures look qualitatively similar, attesting to the precision used in calibration methods in both data reductions to be able to detect relatively small fluctuations over the eclipse which can uncover important information about changing chemical composition, temperature, velocity in the line-of-sight, and reveal indicators of luminosity and age.